
Data Analysis(Power BI + ArcGIS)
1. Crash Analysis
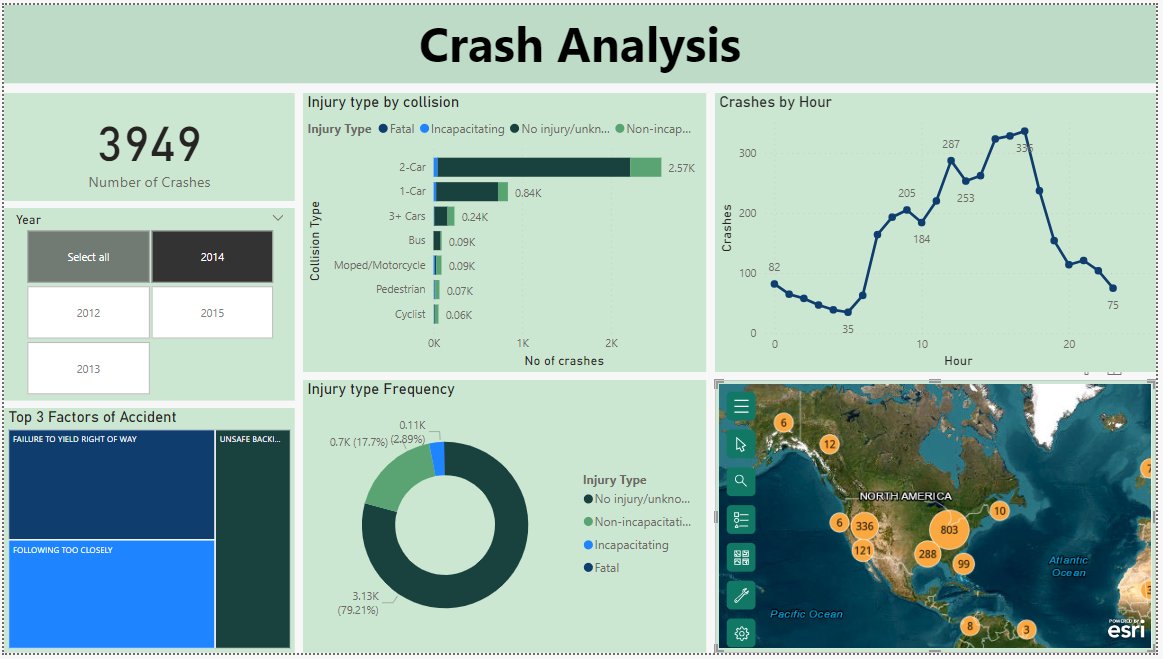
Objective: To analyze crash data and identify patterns, contributing factors, and potential interventions to improve road safety and reduce accident rates.
Key Responsibilities:
Acquired and processed crash data from government databases or other sources, ensuring data integrity and completeness.
Developed geospatial visualizations to map crash locations and identify hotspots or high-risk areas.
Conducted time-series analysis to identify trends and patterns in crash occurrences over time.
Collaborated with transportation agencies and safety experts to interpret findings and propose recommendations for preventive measures.
Technologies Used: Power BI, Arc GIS
Achievements:
Identified contributing factors to crashes such as road conditions, weather, driver behavior, and vehicle type, enabling targeted interventions and policy recommendations.
Developed predictive models to forecast crash probabilities and prioritize resources for prevention efforts.
Key Learnings: Explored the application of data analytics in the domain of road safety and transportation planning. Learned to leverage geospatial analysis techniques to identify and mitigate crash risks effectively.
2. Data Profession Survey Breakdown
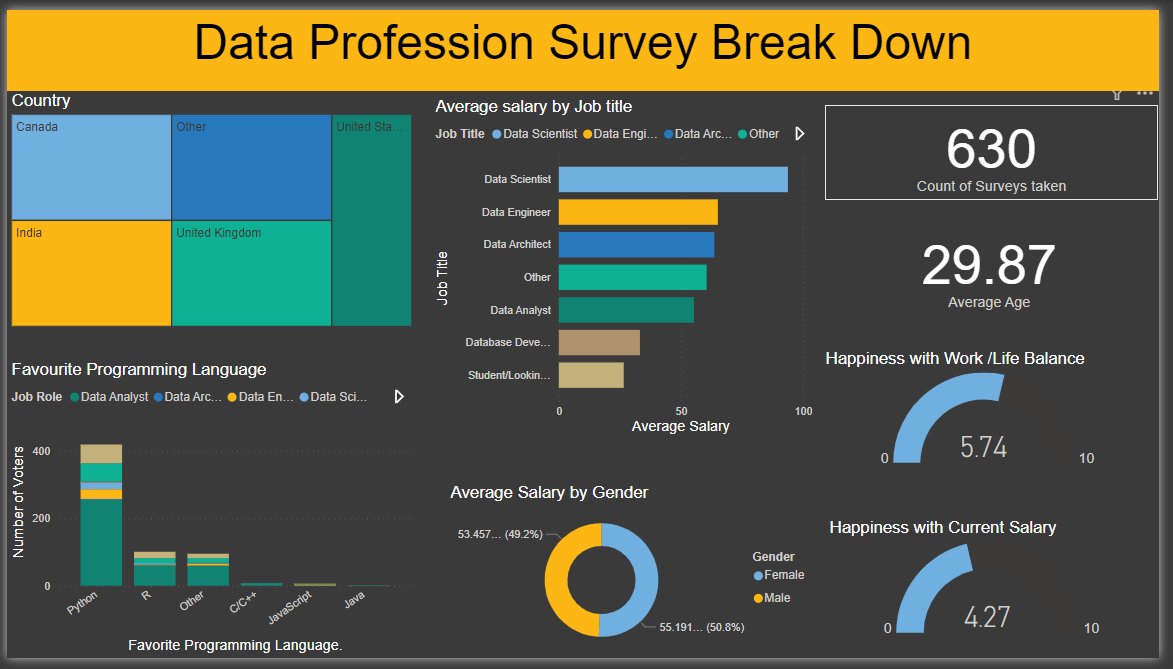
Objective: To analyze and visualize survey data related to the data profession, providing insights into various aspects such as demographics, job roles, skills, and salary trends.
Key Responsibilities:
Cleaned and processed survey data to ensure accuracy and consistency.
Designed interactive dashboards to visualize survey results, allowing for easy exploration of key metrics.
Analyzed demographic trends, job distribution, and salary ranges within the data profession.
Incorporated user-friendly features such as filters and slicers to enhance dashboard interactivity.
Technologies Used: Power BI
Achievements:
Identified key trends and patterns in the data profession, aiding in career planning and decision-making for professionals in the field.
Received positive feedback from users for the intuitive design and usability of the dashboards.
Key Learnings: Explored advanced visualization techniques to effectively communicate complex survey data. Learned to balance aesthetics with functionality to create engaging dashboards.
3. Sleep, Health, and Lifestyle Analysis
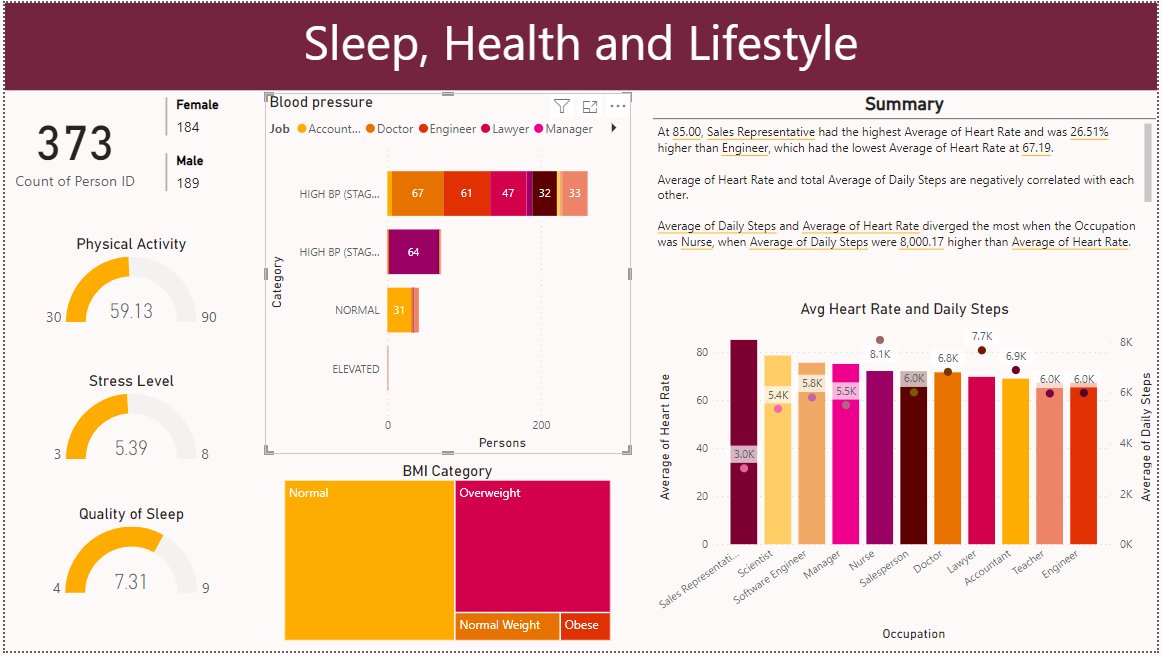
Objective: To analyze the relationship between sleep patterns, health indicators, and lifestyle factors, providing insights into factors that impact overall well-being.
Key Responsibilities:
Compiled and cleaned data from various sources, including sleep trackers, fitness devices, and lifestyle surveys.
Developed data models to correlate sleep metrics with health indicators such as exercise, diet, and stress levels.
Designed visually appealing dashboards to visualize sleep patterns, track health trends, and identify correlations.
Conducted exploratory data analysis to uncover insights into the effects of lifestyle choices on sleep quality and overall health.
Technologies Used: Power BI
Achievements:
Discovered correlations between sleep duration, sleep quality, and various lifestyle factors, providing actionable insights for improving overall health and well-being.
Implemented interactive features such as trend analysis and comparative visualizations to enhance user engagement and understanding.
Key Learnings: Gained insights into the complex interplay between sleep, lifestyle, and health outcomes. Explored methods for integrating disparate data sources to uncover meaningful insights.